A chart displays data in a visually appealing way. By using charts, it is very easy to understand and compare data. We can use Office Excel 2007 for creating charts and Excel Services of MOSS to display it in SharePoint.
Excel Services
Excel Services is part of MOSS 2007. Excel Services has a server-side engine for loading Excel spreadsheets, calculating formulas and rendering their output as wide-reach HTML targeting the browser.
Open the Central Admin--> Operations --> Services on Server then Start the Excel Calculation Service on the server if it is stopped.
Excel Web Access
Excel Web Access is a webpart that displays data and charts from excel workbook. It has similar look like office excel workbook.
Creating a Document Library
Create a Document Library in your MOSS Site. Go to Site Actions --> Create --> Document Library to create document library in your SharePoint Site. This document library will be useful to publish our Excel spread sheets.
Trusted File Location
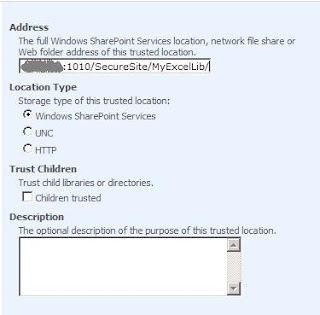
Excel Services opens Excel workbooks that are stored in trusted file locations only. Trusted File location is a SharePoint Document Library, a UNC path, or an HTTP site that is configured as trusted repository for excel workbooks.
Add this newly created excel document library as a trusted file location for storing excel workbooks. To do this, open the Shared Services Administration Site then click the “Trusted File Locations” link from Excel Services Settings. Now, click “Add Trusted File Location” and add our document library as a trusted location.
Creating Charts Using Office Excel 2007
We can use Office Excel 2007 for creating different kinds of charts like Column, Pie, Bar, Area, Scatter etc. See the following image which shows the different chart types available with Office Excel 2007.

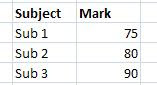
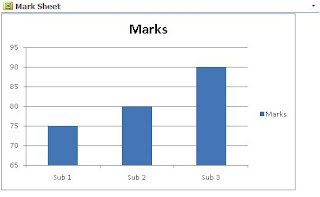
In this sample, I’m going to create a Column Chart by using following sample data.
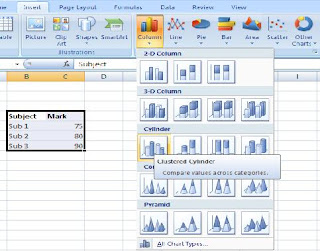
To create Column Chart select the data and Click on Insert-->Column (Chart) and select your desired chart. See the following screen, I’ve selected Clustered cylinder.
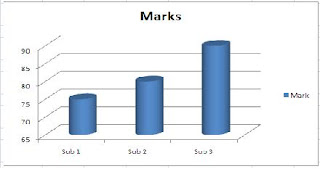
The below chart will be created once the chart type (Clustered Cylinder) is selected. And this chart will be named as “Chart 1”.
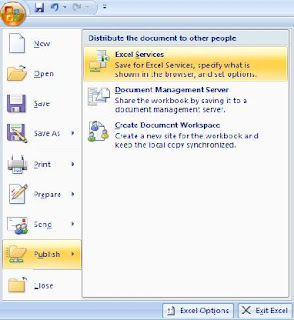
We are going to use Excel Web Access Webpart to display this particular Chart. It is also possible to display the Entire Workbook. Once the chart has been created, publish this workbook to the document library. From the Office menu click Publish-->Excel Services as shown in below image
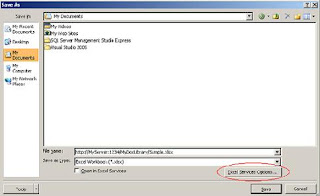
Click on that Excel Services, this will open a “Save As” popup dialog and enter the Document Library path to save this file the Library.
“Open in Excel Services” – Once the form is saved, Excel Services will open the excel workbook in a new browser.
We can add some more options like showing only selected sheets, named items, or adding parameters, etc., with the use of “Excel Services Options”. See the below image which shows the Excel Services Options.
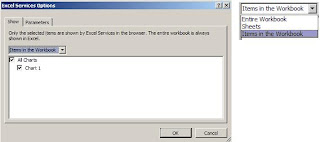
These are the different options available, here we can select the Entire Workbook, only selected sheets or any named item. In our sample, we are going to display only a Chart. Select the “Items in the Workbook”, this will show a list of named items, in our case we have only one item “Chart 1”. Check “Chart 1” from the list. Click “Ok” and save the excel workbook to the Document Library.
There is one more tab “Parameters” which can be used to pass parameters to excel services. Excel Services will create UI by using InfoPath at run time to get input for those parameters.
Now, Open your SharePoint site and add the “Excel Web Access WebPart” to your page.
If this WebPart is not in your list then activate the “Office SharePoint Server Enterprise Site Features” feature.
Once the WebPart is added to the page, Open the Tool pane, this tool pane contains different properties that will be helpful to display the workbook, part of workbook or an item in a workbook.
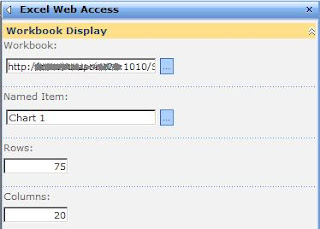
Browse and select the Workbook from the document library, enter “Chart 1” in Named Item property and enter other properties like rows, columns etc. Now, click ok, Excel services will render the chart. If the published workbook contains parameters then an InfoPath form will be displayed along with the chart. InfoPath form will be used to get input and the calculation service of excel will perform the calculation in server and render the results back to the browser.
It is also possible to use Excel Web Services (EWS) hosted in SharePoint that provides several methods that can be used as an API to build custom applications based on Excel workbook.
Excel Services
Excel Services is part of MOSS 2007. Excel Services has a server-side engine for loading Excel spreadsheets, calculating formulas and rendering their output as wide-reach HTML targeting the browser.
Open the Central Admin--> Operations --> Services on Server then Start the Excel Calculation Service on the server if it is stopped.
Excel Web Access
Excel Web Access is a webpart that displays data and charts from excel workbook. It has similar look like office excel workbook.
Creating a Document Library
Create a Document Library in your MOSS Site. Go to Site Actions --> Create --> Document Library to create document library in your SharePoint Site. This document library will be useful to publish our Excel spread sheets.
Trusted File Location
Excel Services opens Excel workbooks that are stored in trusted file locations only. Trusted File location is a SharePoint Document Library, a UNC path, or an HTTP site that is configured as trusted repository for excel workbooks.
Add this newly created excel document library as a trusted file location for storing excel workbooks. To do this, open the Shared Services Administration Site then click the “Trusted File Locations” link from Excel Services Settings. Now, click “Add Trusted File Location” and add our document library as a trusted location.

Creating Charts Using Office Excel 2007
We can use Office Excel 2007 for creating different kinds of charts like Column, Pie, Bar, Area, Scatter etc. See the following image which shows the different chart types available with Office Excel 2007.

In this sample, I’m going to create a Column Chart by using following sample data.

To create Column Chart select the data and Click on Insert-->Column (Chart) and select your desired chart. See the following screen, I’ve selected Clustered cylinder.

The below chart will be created once the chart type (Clustered Cylinder) is selected. And this chart will be named as “Chart 1”.

We are going to use Excel Web Access Webpart to display this particular Chart. It is also possible to display the Entire Workbook. Once the chart has been created, publish this workbook to the document library. From the Office menu click Publish-->Excel Services as shown in below image

Click on that Excel Services, this will open a “Save As” popup dialog and enter the Document Library path to save this file the Library.

“Open in Excel Services” – Once the form is saved, Excel Services will open the excel workbook in a new browser.
We can add some more options like showing only selected sheets, named items, or adding parameters, etc., with the use of “Excel Services Options”. See the below image which shows the Excel Services Options.

These are the different options available, here we can select the Entire Workbook, only selected sheets or any named item. In our sample, we are going to display only a Chart. Select the “Items in the Workbook”, this will show a list of named items, in our case we have only one item “Chart 1”. Check “Chart 1” from the list. Click “Ok” and save the excel workbook to the Document Library.
There is one more tab “Parameters” which can be used to pass parameters to excel services. Excel Services will create UI by using InfoPath at run time to get input for those parameters.
Now, Open your SharePoint site and add the “Excel Web Access WebPart” to your page.
If this WebPart is not in your list then activate the “Office SharePoint Server Enterprise Site Features” feature.
Once the WebPart is added to the page, Open the Tool pane, this tool pane contains different properties that will be helpful to display the workbook, part of workbook or an item in a workbook.

Browse and select the Workbook from the document library, enter “Chart 1” in Named Item property and enter other properties like rows, columns etc. Now, click ok, Excel services will render the chart. If the published workbook contains parameters then an InfoPath form will be displayed along with the chart. InfoPath form will be used to get input and the calculation service of excel will perform the calculation in server and render the results back to the browser.

It is also possible to use Excel Web Services (EWS) hosted in SharePoint that provides several methods that can be used as an API to build custom applications based on Excel workbook.
No comments:
Post a Comment